(a) The time taken by a milkman to
deliver milk to the High Street is normally
distributed with mean time 12 minutes and standard deviation 2 minutes.
Work
to 4 decimal places in this question.
(i) Calculate the probability that, on a given day, he takes less
than 13
minutes to deliver the milk. [3]
(ii) Calculate the probability that, on a given day, he takes more
than 9
minutes to deliver the milk. [3]
(iii) Calculate the probability that, on a given day, he takes between
9
minutes and 13 minutes to deliver the milk. [2]
(b) Let A, B and C be sets. Draw a
Venn diagram of the following sets.

(c) Give 2 advantages and 2 disadvantages
of simulation. [4]
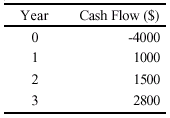
(d) A three-year investment is being
considered for which the net cash flows have
been estimated as follows:

Give your answers correct to 3 significant figures in this question.
(i) Calculate the Net Present Value (NPV) of the project when the
cost of
capital is 10%. [3]
(ii) Calculate the Net Present Value (NPV) of the project when the
cost of
capital is 15%. [3]
(iii) Use linear interpolation and your answers to parts (i) and
(ii) to calculate
the Internal Rate of Return (IRR) for the project. [3]
(e) One conventional die has faces
numbered 1, 2, 3, 4, 5, 6. Another die has faces numbered 4, 4,
5, 5, 6, 6. The score for a throw is the number on the face which
is uppermost when the die is thrown on a horizontal table. If these
two dice are thrown, calculate the probability that the total score
on the two dice is greater
than or equal to 10. [5]

