| (a) | Network analysis is a tool to aid in the management and planning of projects. Explain each of the following three network analysis terms and for each draw the symbol which is used in constructing the network diagram: | |
| (i) Activity | [2] | |
| Activity: a
task or job which uses up resources and time (1 mark). Represented in the network diagram
by an arrow or directed arc (1 mark).
|
||
| (ii) Event | [2] | |
| Event: a point in time
which indicates the start and/or finish of an activity (1 mark). Represented in the
network diagram by a circle (or node) (1 mark).
|
||
| (iii) Dummy Activity | [2] | |
| Dummy Activity: an
activity which does not consume any time or resources and is included in the diagram only
to make clear the logical dependencies between activities in a manner which does not
violate the rules for constructing the diagram (1 mark). Represented in the network
diagram by a dotted arrow or a dotted directed arc (1 mark).
|
||
| (b) | Two dice are rolled simultaneously. | |
| (i) What is the probability that the sum of the two numbers rolled is eight. | [3] | |
| There are 36
possible outcomes of the experiment (1 mark). Five of these outcomes sum to eight (4,4), (3,5), (5,3), (2,6), and (6,2). (1 mark). So the required probablility is 5/36. (1 mark)
|
||
| (ii) Given the number rolled on the first dice is greater than three, does the probability that the sum of the two numbers rolled is eight increase or decrease? Explain your answer | [3] | |
| If we know
that one of the numbers rolled is greater than 3, then it must be a 4, 5 or 6, and so now
there are only 18 possible outcomes (1 mark). Of these only 3 sum to 8 (4,4), (5,3) and (6,2) (1 mark). So the probability of the sum equalling 8 has increased slightly to 1/6 (1 mark). Candidates who enumerate all possible outcome and then add up the appropriate ones correctly should receive full credit.
|
||
| (c) | A company manufactures drinks cartons. The volume, v, of the cartons is normally distributed with mean 1.5 litres and standard deviation of 0.15 litres. What is the probability that the volume of a carton will lie between 1.40 litres and 1.65 litres? | [4] |
| To transform from
the given Normal distribution to the standard Normal distribution we use the
transformation z = (v - m)/s, where m = 1.5, s = 0.15, and the two
values of v of interest are 1.4 and 1.65 (1 mark). So Pr(1.4 < v , 1.65) = Pr((1.4 - 1.5)/0.15
< z < (1.65 - 1.5)/0.15) (1 mark)
|
||
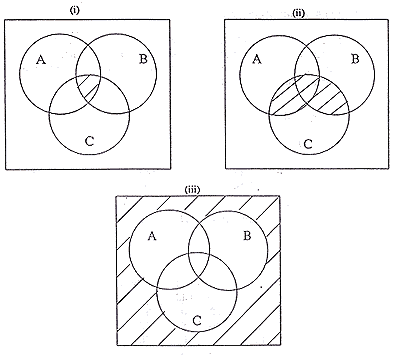
| (d) | A, B amd C are sets. Use Venn Diagrams to illustrate the following operations on these sets (shade in the area which gives the result of the operation). | |
| (i) A |
[1] | |
| (ii) (A |
[1] | |
| (iii) A' |
[2] | |
| One mark each for parts (i) and (ii), two marks for part (iii)
|
